Skip to content
Workers maintaining young high-density native plantation

Services

CSR Plantation Partnership Models for Corporate India

From pilot plantations to multi-acre restoration, every engagement is planned around measurable biodiversity, carbon sequestration, and Section 135 compliance documentation.

Layered

Canopy, understory, shrub, and ground layers are composed as living biodiversity systems, not decorative planting beds.

Measurable

Heat reduction, biodiversity density, soil recovery, and water behavior guide the intervention from concept to monitoring.

Successional

Each site is planned for rapid ecological establishment and long-term succession, so resilience deepens as the landscape matures.

Investment tiers

Scaled to your CSR budget and site.

Ecological restoration is priced around site reality: soil condition, irrigation access, plant density, species count, logistics, water systems, biodiversity targets, and maintenance duration.

These ranges are starting references for serious planning. Each proposal is calibrated after a site assessment and ecological brief.

CSR & Institutional

CSR & CER Plantation Systems

For CSR mandates, CER compliance, corporate campuses, schools, and institutional land.

₹5–25 Lakhs

Typical range

Area
500-5,000 m²
Species
80-200+ native species
Reporting
Survival, biodiversity, carbon, and ESG metrics

Large-scale

Multi-Acre Restoration

For degraded land, watershed repair, biodiversity corridors, and phased multi-year restoration.

₹25 Lakhs+

Custom projects

Scope
Master ecological planning and phased delivery
Monitoring
Aerial documentation, succession planning, long-term stewardship
Management
Multi-year ecosystem monitoring and reporting

Impact layer

A 1,000 m² high-density native forest may sequester several tons of CO₂ annually while reducing ambient surface temperatures, improving rainwater infiltration, and restoring bird and pollinator habitat.

Carbon
Estimated annual sequestration and long-term biomass potential.

Cooling
Surface temperature reduction and microclimate moderation.

Water
Rainwater infiltration increase and runoff reduction potential.

Air quality
AQI improvement direction through dust buffering and leaf area.

Habitat
Pollinator, bird, and urban wildlife restoration targets.

Biodiversity
Native species richness, layer density, and index targets.

Intervention 01

Ecological CSR & CER

CSR mandates · environmental compliance · institutional land

We design and deliver ecological forests for companies meeting CSR obligations, fulfilling Corporate Environmental Responsibility (CER) commitments, or investing in verified green infrastructure on institutional land — from factory buffers and mine-adjacent parcels to school campuses and community forests.

  • CSR forests aligned with Companies Act Schedule VII — afforestation, environmental sustainability, and rural or community benefit — with employee planting days, launch events, and board-ready impact documentation.
  • CER landscapes for environmental compliance: compensatory afforestation, pollution-offset greenbelts, regulator-facing restoration, and long-term stewardship on land tied to industrial or development liability.
  • ESG and sustainability reporting with survival monitoring, biodiversity indices, canopy closure, heat reduction, and photographic evidence trails stakeholders can audit.
  • Educational biodiversity campuses, corporate sustainability forests, and institutional greening on schools, universities, industrial sites, and dedicated CSR land banks.
  • Heat reduction, climate resilience, community engagement programming, and multi-year maintenance strategy so projects remain credible after the inauguration.

Want to implement directly without an agency? See our direct implementation guide for CSR afforestation under Rule 4(1).

Typical investment

₹5–25 Lakhs

Planned for 500–5,000 m² CSR and CER ecological systems with 80–200+ species, compliance or ESG reporting requirements, biodiversity targets, and establishment maintenance.

Discuss a CSR or CER ecology plan
Field team tending young native saplings during establishment

CSR and CER, from intent to evidence

CSR ecology earns trust when community benefit and board reporting are built in. CER ecology earns trust when compliance planting, survival, and regulator-facing documentation are planned as one system — not a one-day inauguration.

CSR focus

Schedule VII alignment, employee and community engagement, ESG storytelling, and annual impact updates for sustainability committees and annual reports.

CER focus

Environmental liability restoration, compensatory afforestation, mandated greenbelts, pollution-offset landscapes, and documentation suited to compliance audits.

Process flow

  1. 01 Site Assessment
    Baseline conditions, constraints, and opportunity mapping.
  2. 02 Ecological Strategy
    Impact goals, engagement model, and sustainability alignment.
  3. 03 Soil Rehabilitation
    Compaction relief, organic matter, and biological preparation.
  4. 04 Species Planning
    Native matrices matched to site stress and biodiversity goals.
  5. 05 High-Density Planting
    Field execution with density, spacing, and establishment discipline.
  6. 06 Irrigation Systems
    Efficient establishment water with tapering and monitoring logic.
  7. 07 Monitoring & Reporting
    Biodiversity, survival, canopy, heat, and stewardship documentation for stakeholders.

Intervention 02

Large-Scale Ecological Restoration

Multi-acre land · degraded sites · corridors

Landscape-scale restoration of degraded land into resilient native ecosystems capable of long-term ecological succession.

  • Multi-acre restoration, rewilding degraded land, watershed restoration, and native biodiversity corridors.
  • Soil regeneration, flood mitigation, heat island reduction, and invasive species replacement.
  • Before/after transformations documented with aerial imagery, biodiversity density visuals, succession diagrams, and environmental metrics.

Large-scale range

Custom from ₹25 Lakhs+

Investment is shaped by acreage, access, soil remediation, water infrastructure, planting density, documentation, and multi-year stewardship.

Plan a restoration assessment
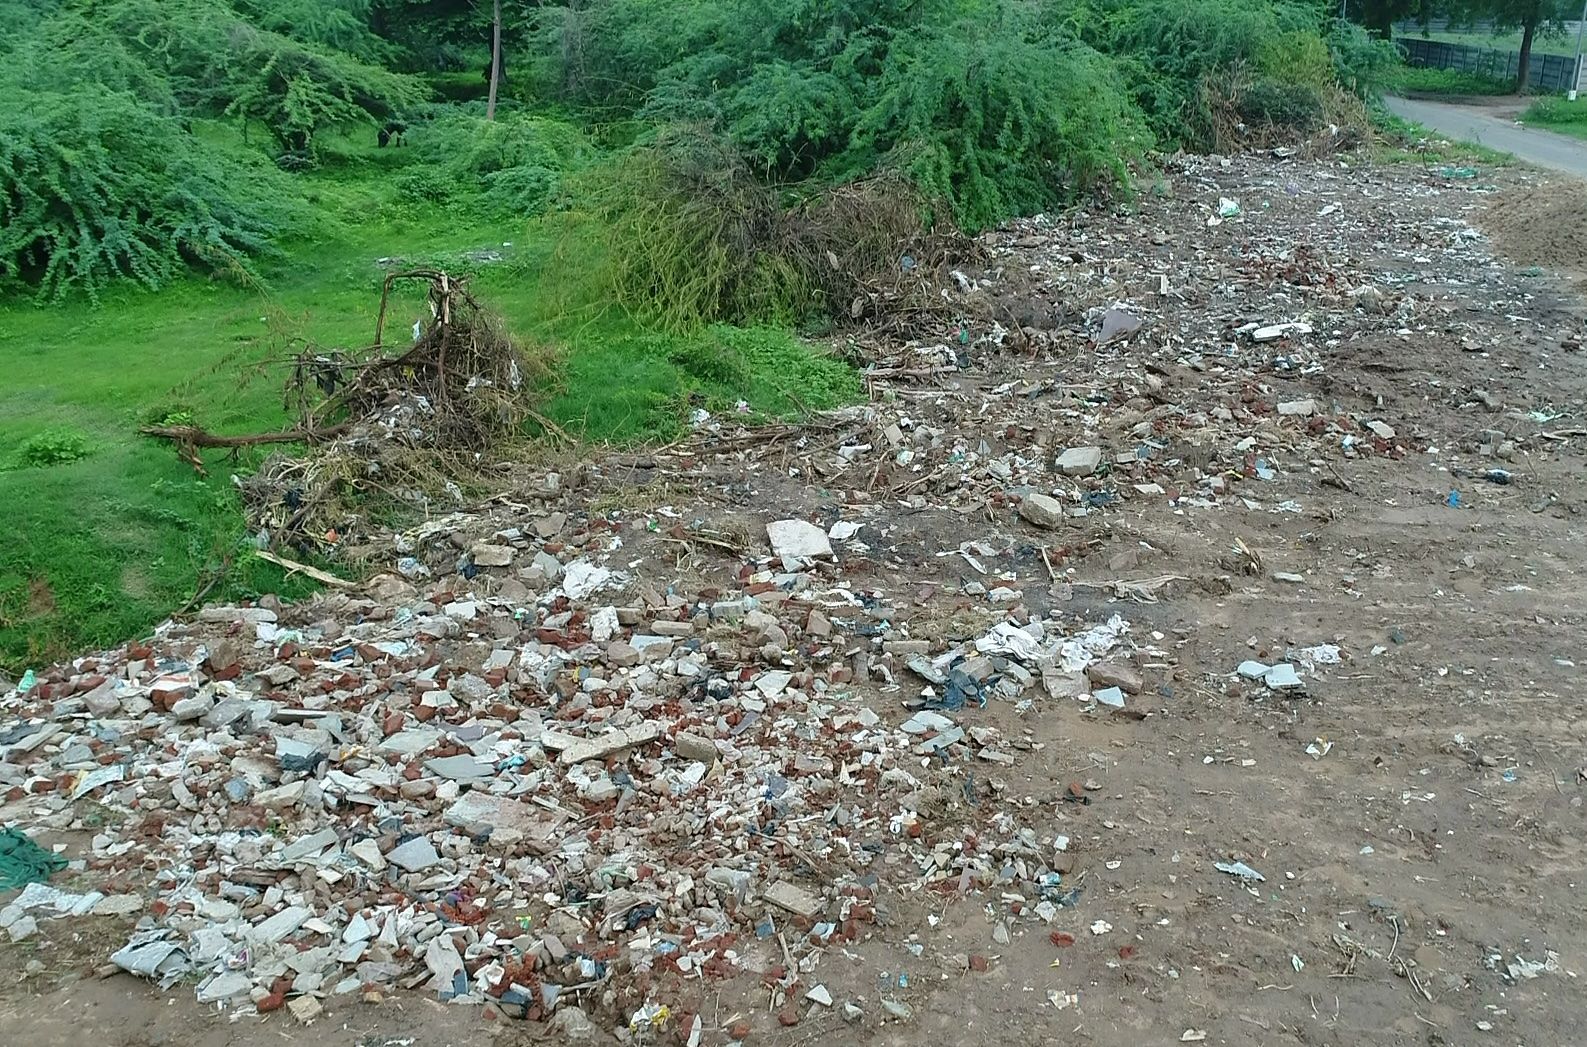
Debris and construction waste site before ecological restoration
Before · exposed ground
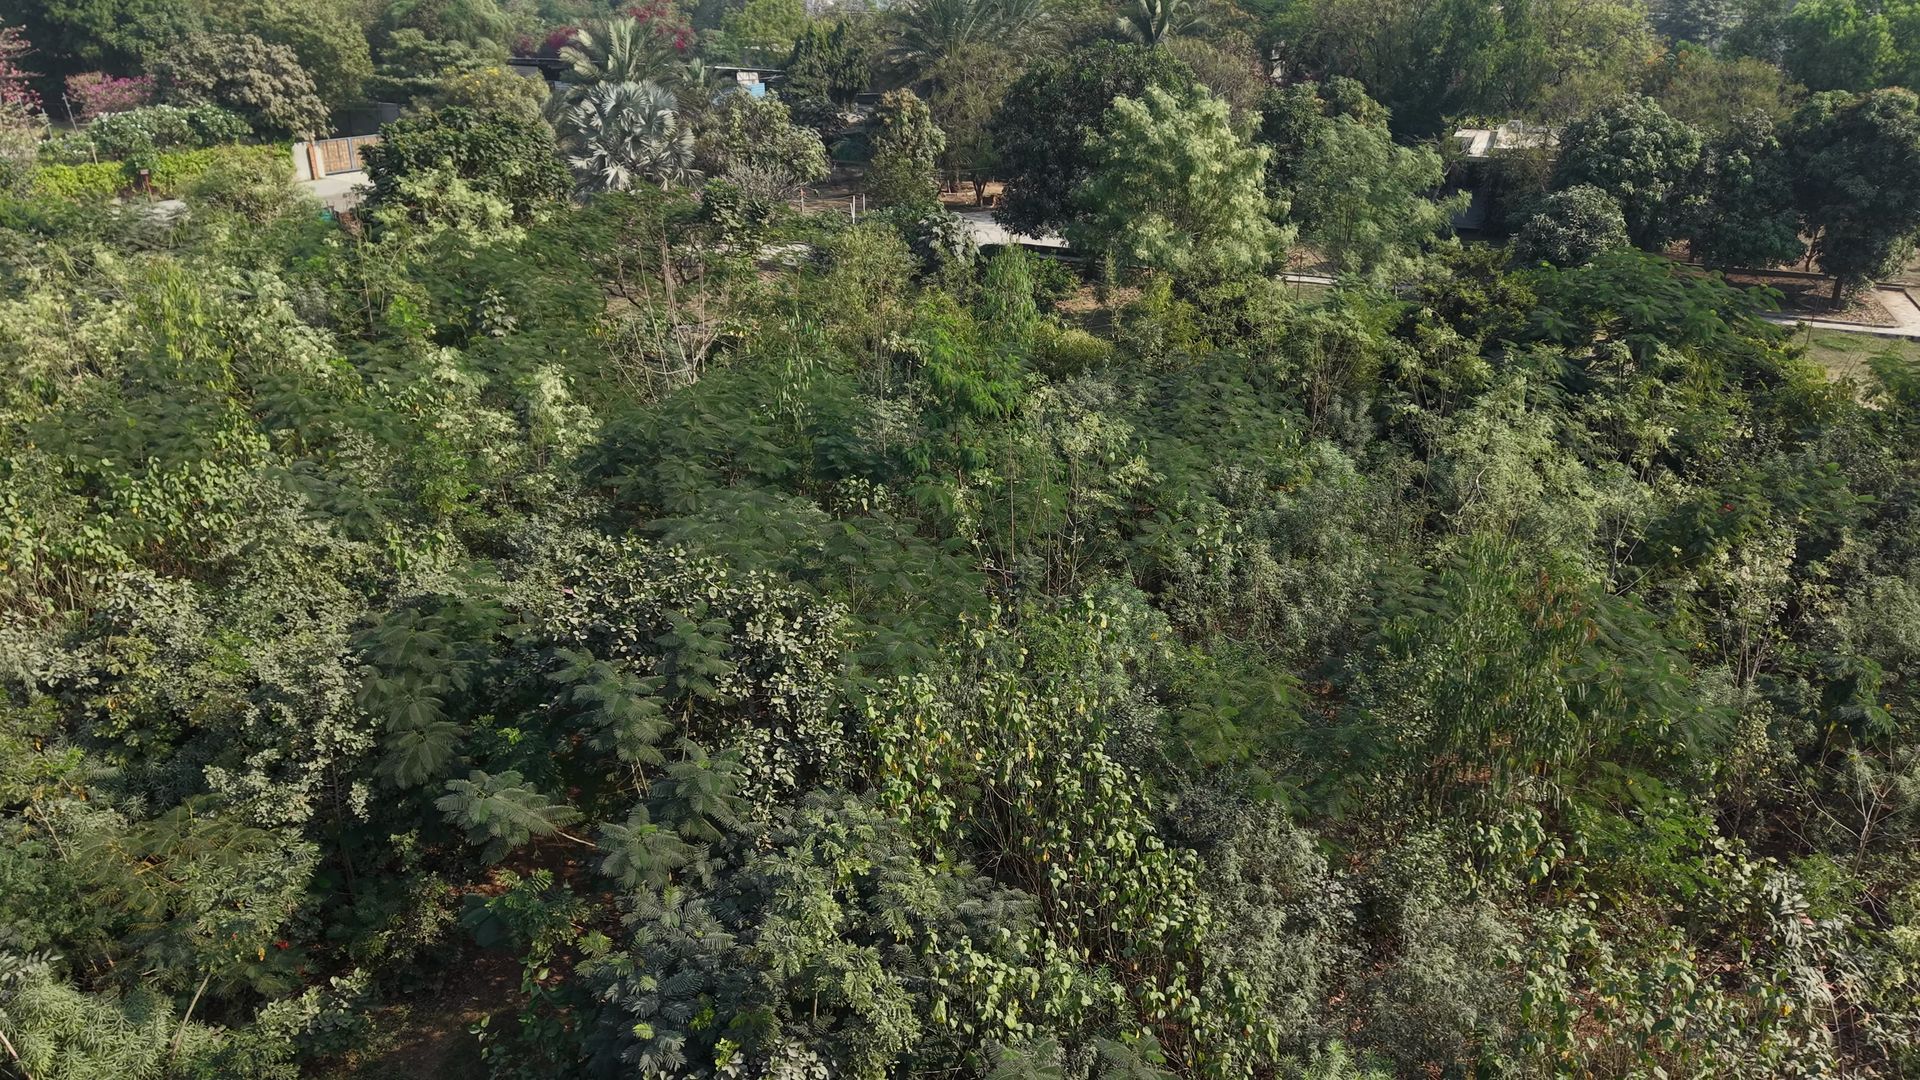
Same degraded site after ecological restoration — dense native canopy
After · canopy succession
Aerial imageryOverhead documentation of canopy spread, corridors, and restored patches.
Biodiversity densityVisual tracking of species richness and habitat layering over time.
Succession diagramsPhased views from soil repair to pioneer canopy and mature native structure.
Environmental metricsHeat, water, soil, survival, and biodiversity indicators for long-term reporting.

Capabilities

Multi-acre implementation
Field logistics, phasing, and labor planning for large restoration windows.

Native species diversification
High-diversity matrices for canopy, understory, edge, and habitat function.

High-density planting logistics
Nursery coordination, layout systems, and field quality control.

Ecological succession planning
Species and stewardship choices that anticipate maturity, self-thinning, and habitat complexity.

Water management systems
Infiltration, runoff moderation, water retention, and climate-aware irrigation logic.

Long-term monitoring
Survival, biodiversity, canopy closure, soil recovery, and adaptive restoration notes.

Intervention 03

Agroforestry & Ecological Farming

Productive ecosystems · regenerative land systems

Productive ecological farming systems designed around biodiversity, water retention, soil regeneration, and climate resilience.

  • Multi-layer agroforestry, native support species, biodiverse orchards, pollinator systems, and windbreak forests.
  • Ecological farm design, shade ecology systems, and water retention landscapes for durable productivity.
  • Agriculture framed as ecological resilience through biodiversity, not monoculture farming.

Ecological farm systems

Starting from ₹5 Lakhs

Scoped around productive area, water retention needs, species palette, soil regeneration intensity, and long-term farm management goals.

Explore an agroforestry plan
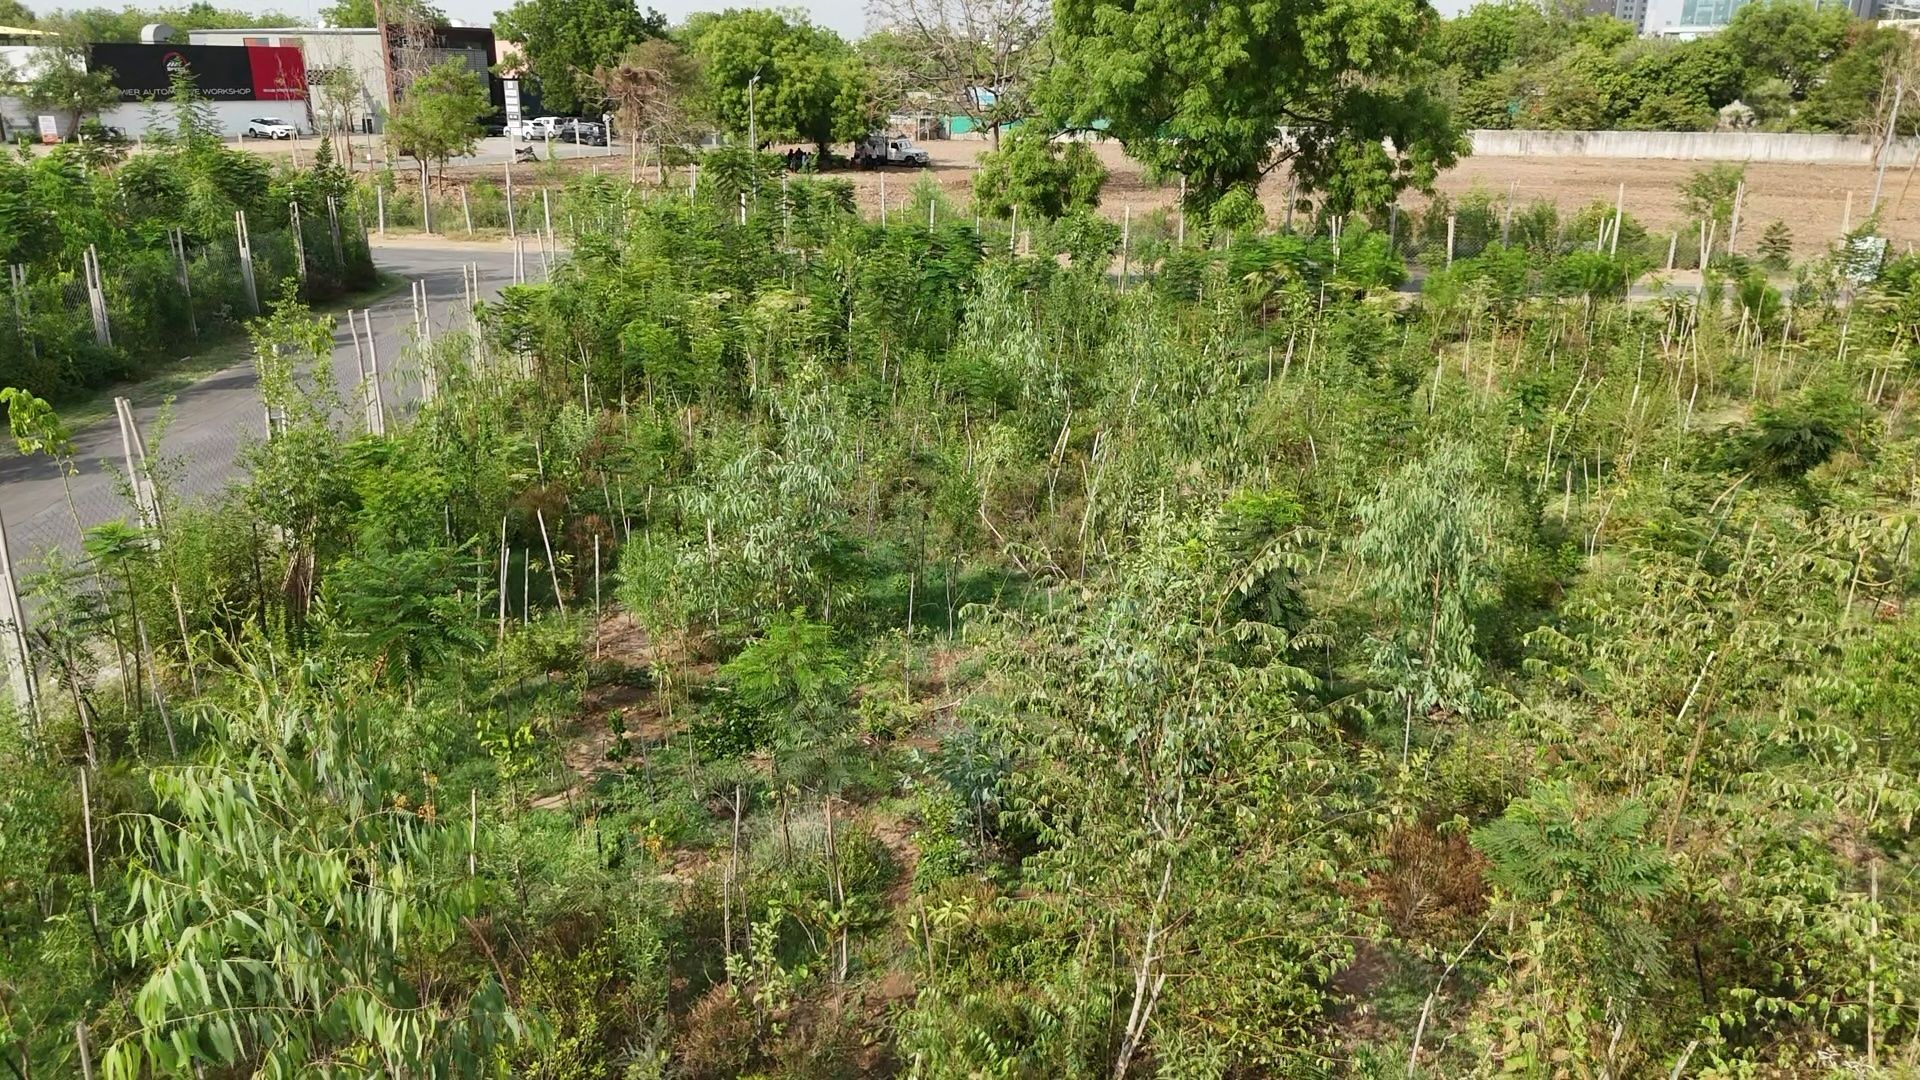
Field work during ecological plantation establishment

Ecological productivity

Tree crops, support species, water retention, and pollinator habitat work together as a productive ecosystem.

CanopyFruit, timber, shade, and wind moderation.
SupportNitrogen, biomass, mulch, and microclimate.
PollinatorsBloom continuity for yield and biodiversity.
WaterRetention landscapes that slow runoff and evaporation.

Intervention 04

Oxygen Parks

Urban ecological parks · community infrastructure

Urban ecological parks designed to improve air quality, reduce urban heat, enhance biodiversity, and provide restorative green infrastructure for communities.

  • Urban cooling landscapes, public biodiversity parks, native ecological corridors, and air-quality improvement systems.
  • Public ecological education, recreational ecological spaces, and urban habitat restoration.
  • Walking paths, dense native canopies, ecological seating zones, and biodiversity learning areas.

Public project range

₹5–25 Lakhs+

Oxygen park investments depend on pathways, lighting, public interface, water systems, safety requirements, plantation density, and maintenance tenure.

Develop an oxygen park brief
Satellite view of restored canopy cover at the Miyawaki site
TemperatureReduced ambient temperatures through canopy shade and evapotranspiration.
Air qualityAQI improvement direction through dust buffering and living biomass.
CarbonCarbon sequestration in biomass and soil organic matter.
PollinatorsPollinator support through native flowering matrices.
Well-beingPsychological restoration through shaded walking, seating, and sensory ecology.
BiodiversityUrban biodiversity increase through habitat corridors and learning zones.

Intervention 05

Ecological Consulting

Scientific ecological planning and restoration strategy services for regenerative landscape development and biodiversity systems.

  • Ecological site analysis, species matrix development, canopy architecture planning, and biodiversity strategy.
  • Soil restoration planning, water management systems, succession dynamics, restoration phasing, and climate resilience planning.

Custom projects

For clients comparing sites, planning CSR impact, integrating architecture with ecology, or defining a long-term restoration roadmap before implementation begins.

Forest layers

Canopy
Understory
Shrub
Ground layer

Succession

  1. Year 0 Soil repair and pioneer establishment
  2. Year 2 Canopy acceleration and habitat arrival
  3. Year 5+ Self-thinning, shade maturity, biodiversity depth

Water cycles

Rain capture, infiltration, mulch protection, evapotranspiration, and runoff moderation are mapped before planting density is finalized.

Canopy density maps

Shade architecture, edge exposure, access routes, and biodiversity systems are visualized so restoration decisions remain legible to boards, committees, and field teams.

Geo-tagged reporting & monitoring

Inspection-ready documentation, from Day 1.

Every plantation we deliver comes with geotagged baseline data, periodic aerial documentation, and survival tracking mapped to GPS coordinates. If your auditor visits the site tomorrow, they can match every data point to the ground.

Geotagged boundaries

Plantation perimeters and plot-level GPS coordinates recorded at baseline and updated each monitoring cycle.

Aerial time-series

Drone and aerial imagery captured at planting, 6 months, 12 months, and annually thereafter — canopy closure visible over time.

Survival tracking

Per-plot survival counts with photographic evidence, not clipboard estimates. Gap replacement tracked against baseline.

BRSR & GCP-ready

Data structured for BRSR Principle 6 disclosure and Green Credit Programme verification — canopy density, species counts, and survival in audit-ready format.

This is included in every CSR and CER engagement. For clients with existing plantations managed by other vendors, we also offer geo-tagged monitoring as a standalone consulting service — ask about standalone monitoring.

Pricing

Transparent indicative pricing for CSR plantation projects.

Every site is different — soil condition, species selection, irrigation access, and terrain all affect final cost. These ranges reflect market rates for Miyawaki-style dense native plantations in India, including soil preparation, saplings, planting, and 24-month establishment maintenance. Final quotes are site-specific.

Pilot Plantation

₹1.5–5 Lakhs

500–1,000 m² (5,400–10,800 sq ft)

  • 20–50 native species, 3–5 saplings/m²
  • Soil testing, amendment, and mulch
  • 24-month establishment maintenance
  • Survival counts and photographic reporting
  • Section 135 / BRSR compliance dossier

Ideal for CSR pilots, school campuses, and first-year demonstration plots.

Standard CSR Plantation

Most common

₹5–25 Lakhs

1,000–5,000 m² (10,800–54,000 sq ft)

  • 50–100+ native species, layered canopy design
  • Full soil engineering and water management
  • 24-month maintenance with gap replacement
  • BRSR Principle 6 + carbon projection reporting
  • MRV-ready data for carbon credit / GCP applications
  • Board-ready compliance dossier and executive brief

Typical for corporate CSR mandates, institutional greenbelts, and ESG-aligned restoration.

Multi-acre Restoration

₹25 Lakhs+

1+ acre (4,000+ m² / 43,000+ sq ft)

  • 100+ species, full biodiversity matrix
  • Phased delivery across monsoon cycles
  • 24-month maintenance + extended monitoring
  • Carbon credit / GCP application support
  • Multi-site consolidated reporting
  • Dedicated project manager and field team

For large-scale CSR, CER, and government restoration mandates.

What's included in all tiers

  • Soil preparation, saplings, planting, and mulch
  • 24-month establishment maintenance
  • Gap replacement through first 2 monsoons
  • Survival counts and photographic evidence
  • Section 135 / BRSR compliance documentation

Factors that affect cost

  • Soil condition and amendment requirements
  • Site accessibility and terrain (slopes, rocky ground)
  • Species selection and sapling availability
  • Irrigation infrastructure needs
  • Project scale (economies of scale above 1,000 m²)

Market context

Miyawaki plantation costs in India typically range from ₹200–800 per m² (₹300–500 optimal), with 15–25% savings on projects above 1,000 m². Traditional plantation costs ₹50–150 per m² but delivers 3–5× less biomass and 100× less biodiversity.

These are indicative ranges for budgeting purposes. Final pricing is determined after site assessment and species curation. Request a site-specific proposal →

Free download

CSR vendor checklist

12-point checklist to evaluate any plantation vendor on survival rates, species selection, monitoring, and compliance.

Download

Free download

Direct Implementation Guide

How to implement CSR afforestation directly under Rule 4(1) — no CSR-1 agency required. Includes compliance checklist.

Download

Free download

Why Miyawaki forests matter

Research-backed brief on societal benefits: carbon, air quality, cooling, biodiversity, employee wellbeing. Mapped to BRSR & SDGs.

Download

Free download

BRSR reporting template

Structured template for reporting afforestation data under BRSR Principle 6. Fillable fields with example data from our Makarba project.

Download

FAQ

Questions CSR buyers ask us.

How do you document Section 135 and BRSR compliance?

Every project comes with a compliance dossier aligned to Companies Act Schedule VII — specifically the environmental sustainability, biodiversity, and rural/community benefit clauses. The dossier includes the ecological brief, site assessment, species list with native percentages, planting records, survival counts, photographic evidence, and a mapping to the relevant Schedule VII categories your auditors need.

For BRSR reporting, our outputs map directly to Principle 6 (environmental responsibility) disclosures — biodiversity index, canopy coverage, estimated carbon sequestration, species count, and survival rates — all in a structured format your sustainability team can drop into BRSR Core KPI tables without rework.

We deliver this at project kickoff (for board approval), at planting completion (for first-year reporting), and at each monitoring milestone through the maintenance period.

What reporting format do you provide for ESG and CSR boards?

We provide six categories of measured outcomes: biodiversity (species richness, native percentage, pollinator counts, bird surveys), carbon (estimated annual sequestration, biomass potential), survival (establishment rates, replanting records, multi-year tracking), temperature (surface reduction, microclimate moderation), water (infiltration, runoff reduction), and compliance (Schedule VII alignment, BRSR Principle 6 mapping, CER records, audit trails).

Reports are delivered as structured PDFs with photographic evidence, data tables, and a summary executive brief suitable for board presentations, BRSR Core disclosures, and ESG investor communications.

What is the minimum project size you take on?

The minimum practical site size for a Miyawaki-style dense plantation is approximately 500 m² (roughly 5,400 sq ft). Below that, the species diversity and canopy closure dynamics that make the method effective don't have enough room to develop.

For CSR and CER engagements, the typical range starts at 500–5,000 m² (₹5–25 Lakhs). Multi-acre restoration projects start at ₹25 Lakhs+ for degraded land, watershed repair, and biodiversity corridors.

How long is the maintenance and monitoring period?

The establishment phase — watering, mulching, weed suppression, survival checks, and gap replacement — runs for the first 2–3 years. This is when the forest is most vulnerable and when intervention matters most.

Monitoring continues beyond establishment. We track survival, growth, canopy closure, biodiversity signals, and carbon accumulation through multi-year cycles. For CSR projects, we recommend a minimum 3-year monitoring commitment so your board has year-over-year data, not just a planting-day photo.

What happens if survival rates are low?

Gap replacement is built into the establishment phase. We replant failed saplings during the first 2 monsoon cycles as part of the maintenance protocol — not as an extra charge, but as standard practice.

Survival rates in our documented case study exceeded expectations for arid-zone restoration — the flagship 5-acre project has a documented survival rate exceeding 90%. When conditions are harsher than anticipated, we adjust species mix, density, and water strategy based on what the site tells us. The goal is an established forest that functions without ongoing intervention, not a maintained garden.

Can you handle multi-site deployments across states?

Yes. Species selection, soil preparation, and planting timing are calibrated to each site's local climate, soil, and native species pool — what works in Gujarat doesn't automatically work in Maharashtra or Karnataka. We adapt the methodology, not just replicate it.

For multi-site CSR programs, we provide consolidated reporting across all sites with site-specific breakdowns, so your sustainability team can compare outcomes and allocate future budgets with evidence.

Do you work with CSR implementing agencies or directly with companies?

Both. We work directly with CSR foundations and corporate sustainability teams, and we also partner with CSR implementing agencies that need a specialized ecological restoration partner for the plantation and monitoring components of a larger program.

If your company works through an implementing agency, we can integrate our reporting into their existing compliance framework so your board sees a single coherent narrative.

What is the typical timeline from first contact to planting?

From first contact to planting day typically runs 8–16 weeks: site assessment (1–2 weeks), species curation and proposal (2–4 weeks), soil preparation and logistics (3–6 weeks), and planting (1–2 weeks depending on scale). Larger multi-acre projects may extend to 6–9 months for phased delivery.

Planting timing is tied to monsoon arrival — in Gujarat, the optimal window is June–September. We plan backward from that window so your CSR team can schedule launch events and board communications with confidence.

Can your data feed into carbon credit or Green Credit Program applications?

Our monitoring data — species inventory, survival rates, canopy density, biomass estimates, and time-series growth records — is structured to meet the MRV (Measurement, Reporting, and Verification) standards that carbon credit and Green Credit Program (GCP) protocols require. We work with accredited third-party verifiers when your project needs formal credit issuance.

Even if you're not pursuing credits immediately, having data that is credit-ready from Day 1 means your forest's carbon sequestration is documented and verifiable — not a retroactive estimate. This positions your CSR investment as a future financial asset, not just a compliance expense.